Spain
Spain
 Portugal

Chapter 5. Technical indicators
What is a technical indicator?
Technical indicators display indicators related to financial instruments. They can be based on price, volume, on-chain data, open positions, social indicators or even other indicators.
As we have already said, the methods of technical analysis are based on the assumption that the historical behavior of the price may indicate its future movement. Consequently, traders relying on technical analysis can use various technical indicators to identify potential entry and exit points on the chart.
Technical indicators can be classified in different ways. For example, they can indicate a future trend (leading), confirm an existing pattern (lagging) or clarify events in real time (matching indicators).
Indicators can also be distinguished depending on how they present information. In this sense, there are overlay indicators that overlay data on top of the price, and oscillators that fluctuate between the minimum and maximum values.
There are also types of indicators depending on which aspect of the market they seek to measure, for example, impulse indicators that display market momentum.
Which technical indicator is better? There is no simple answer to this question. Traders can use many different indicators, and the choice largely depends on their personal trading strategy. But to be able to make this choice, you first need to learn more about the indicators – and this is exactly what this chapter is about.
Leading and lagging indicators
As already mentioned, different indicators have their own special properties and a specific purpose. Leading indicators indicate future events, while lagging indicators confirm what has already happened. When should they be used?
Leading indicators are usually useful for short- and medium-term analysis. They are used when analysts anticipate a particular trend and are looking for statistical tools to substantiate their hypothesis. Leading indicators can be especially useful when forecasting economic recessions.
Leading indicators are also useful in trading and technical analysis. However, no indicator can accurately predict the future, so such forecasts should always be treated critically.
Lagging indicators are used to confirm events and trends that have already taken place or are unfolding now. Although it may seem superfluous, sometimes it is very useful. Lagging indicators can reveal some unnoticed aspects of the market. Therefore, lagging indicators are usually used in long-term chart analysis.
What is a pulse indicator?
Pulse indicators measure and display market momentum. What is market momentum? To put it simply, this is an indicator of the rate of price change. Pulse indicators measure the rate of price growth or decline. Consequently, they are usually used in short-term analysis by traders who want to make money on volatility spikes.
The goal of an impulse trader is to enter the market when momentum is high and exit when it is falling. As a rule, when volatility is low, the price remains in a narrow range. When the tension increases, the price often makes a strong impulse spurt beyond this range. And such periods are favorable for impulse traders.
After the movement has ended and traders have left their positions, they move to another asset with a high momentum and try to repeat the same plan. Thus, pulse indicators are actively used by day traders, scalpers and short-term traders looking for opportunities for quick trades.
What is trading volume?
Trading volume can be considered as a basic indicator. It shows the number of units of the asset traded in a certain period, that is, how much of the asset changed hands in a given period of time.
Some consider trading volume to be the most important technical indicator. In trading, it is often said: the volume is ahead of the price. That is, a large trading volume can serve as a leading indicator of a significant price movement (regardless of the direction).
With the help of volume, traders can measure the strength of the underlying trend. If high volatility is accompanied by a large trading volume, then this can be considered a confirmation of the movement. This is logical, since high trading activity should correspond to a significant volume, because there are many traders and investors active at this price level. However, if volatility is not accompanied by a large volume, then the underlying trend can be considered weak.
Price levels with historically high volume can also provide traders with good potential entry or exit points. Since history repeats itself often, increased trading activity is more likely at these levels. Ideally, to confirm the strength, the volume jump should also be combined with support and resistance levels.
What is the Relative strength index?
The Relative Strength Index (RSI) is an indicator illustrating the overbought or oversold nature of an asset. This is a pulse oscillator showing the rate of price change. This indicator varies from 0 to 100, and the data is usually depicted on a line chart.
What is the essence of measuring market momentum? If the momentum grows at the same time as the price increases, then the uptrend can be considered strong. Conversely, if the momentum decreases with an uptrend, then the trend can be considered weak. In this case, a reversal may be approaching.
Consider an example of the traditional interpretation of RSI. When the RSI value is less than 30, the asset is considered oversold. Conversely, when the index is greater than 70, it is considered overbought.
However, the RSI should be treated with a bit of skepticism. The index can reach extreme levels in case of extraordinary market conditions – while the market trend may continue for some time.
RSI is one of the simplest technical indicators to understand, which makes it one of the best for novice traders.
What is the Moving Average (MA)?
Moving averages smooth out price behavior, making it easier to see market trends. Since they are based on previous price data, they do not have predictive properties. Therefore, moving averages are considered lagging indicators.
There are different types of moving averages. The two most common are simple (SMA) and exponential moving average (EMA). How do they differ?
When calculating a simple moving average, price data for the previous n units of time is taken and the average value is calculated. For example, the 10-day SMA calculates the average price for the last 10 days, after which the result is shown on the chart.
The exponential moving average is somewhat more complicated. It uses a different formula, where the most recent price data is more important. As a result, the EMA reacts faster to the latest developments in price behavior, whereas the SMA takes longer to do this.
As already mentioned, moving averages are lagging indicators. The longer the period they cover, the greater the lag. Thus, a 200-day moving average will react slower to changes in price behavior than a 100-day moving average.
What is the convergence/divergence of Moving Averages (MACD)?
Convergence-Divergence of Moving Averages (MACD) is an oscillator that uses two moving averages to show market momentum. Since it tracks the price behavior that has already taken place, it is a lagging indicator.
The MACD consists of two lines: the MACD line and the signal line. How are they calculated? For the MACD line, the EMA for 26 units of time is subtracted from the EMA for 12 units of time. And the signal line is the EMA of the MACD line for 9 units of time. A histogram showing the distance between the MACD line and the signal line is also often used.
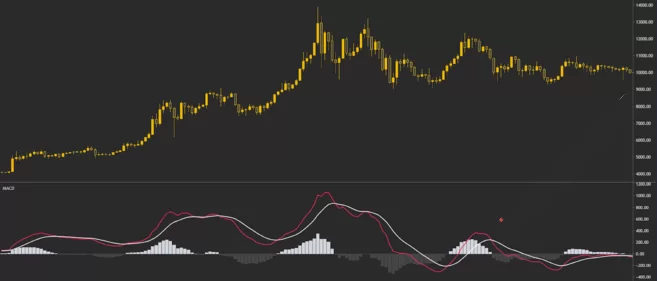
Traders can monitor the relationship between the MACD line and the signal line. Their intersection is usually a remarkable event. If the MACD line crosses the signal line up, then this can be interpreted as a bullish signal. Conversely, if the MACD line crosses the signal line down, it can be interpreted as a bearish signal.
MACD is one of the most popular technical indicators for measuring market momentum.
What is the Fibonacci Retracement?
The Fibonacci Retracement is a popular indicator based on a sequence of numbers known as the Fibonacci series. These numbers were found in the XIII century by the Italian mathematician Leonardo Fibonacci.
Many technical indicators are based on Fibonacci numbers, and the Fibonacci correction is one of the most popular. It uses coefficients derived from Fibonacci numbers and expressed as a percentage. These percentages are shown on the chart, and with their help, traders can determine potential support and resistance levels.
Here are the Fibonacci coefficients:
0%;
23,6%;
38,2%;
61,8%;
78,6%;
100%.
Although 50% is not formally a Fibonacci coefficient, many traders also consider this value. In addition, Fibonacci coefficients that go beyond the range of 0%-100% can be used: most often 161.8%, 261.8% and 423.6%.
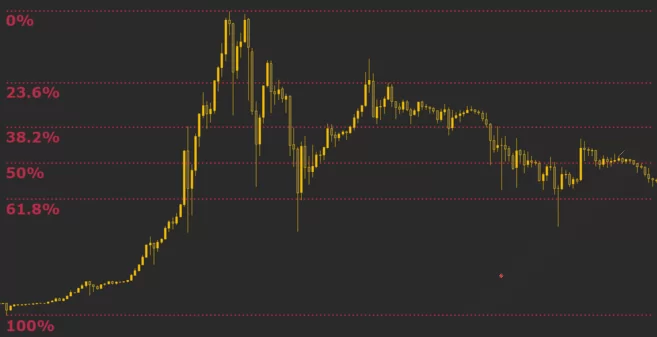
How do traders use Fibonacci retracement levels? Coefficients are plotted on a graph to find interesting zones. As a rule, traders select two significant points on the price chart and assign them Fibonacci correction values of 0 and 100. Using the coefficients between these values, you can find potential entry and exit points, which will also help you set stop losses.
Fibonacci Retracement is a flexible tool that can be used in different trading strategies.
What is stochastic RSI?
Stochastic RSI, or StochRSI– is a modification of the relative strength index (RSI). As in the case of the RSI, the main purpose of the StochRSI is to determine whether an asset is oversold or overbought. But, unlike the RSI, the StochRSI is calculated not from price data, but from the RSI values. In most cases, the values of the StochRSI vary from 0 to 1 (or from 0 to 100).
The StochRSI is most useful when it is near the upper or lower end of the range. However, due to the higher speed and sensitivity, it can produce many false signals that are difficult to interpret.
The traditional interpretation of the StochRSI resembles the RSI. When it is more than 0.8, the asset is considered overbought, and below 0.2 - oversold. But it is worth noting that these should not be considered as direct signals for entry or exit. While this information definitely sheds light on the situation, there may also be other aspects. Therefore, most technical analysis tools are best used in combination with other analytical methods.
What are Bollinger Bands?
Named after John Bollinger, Bollinger Bands measure market volatility and are often used to determine overbought or oversold. This indicator consists of three lines forming two bands, with the middle line being the SMA. These lines are superimposed on the price chart. The idea is that when volatility increases or decreases, the distance between the lines changes and the bands widen or narrow.
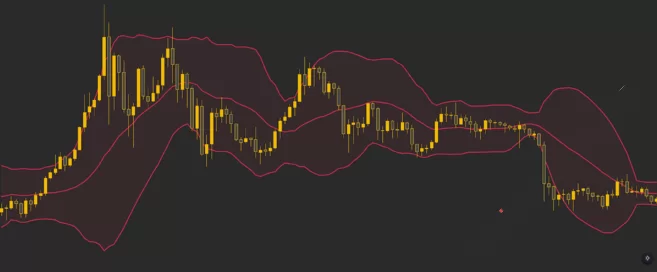
Consider the general interpretation of Bollinger bands. The closer the price is to the upper line, the closer the asset is to overbought. The closer it is to the bottom line, the closer the asset is to oversold.
It is worth noting that usually the price is inside the bands, but sometimes it can go higher or lower. Is this an immediate buy or sell signal? No. This only means that the market deviates from the middle line (SMA) and reaches extreme conditions.
Traders can also use Bollinger Bands to predict the "compression" of the market. This refers to a period of low volatility, when the lines are very close to each other, "pinching" the price in a very narrow range. When the "pressure" in this narrow range becomes large enough, the market will "shoot" out of it, which will lead to a period of increased volatility. Since the market can go both up and down, the "compression" strategy is considered neutral (neither bullish nor bearish). Therefore, it should be combined with other trading instruments, such as support and resistance.
What is the volume-weighted average price?
As already mentioned, many traders consider trading volume to be the most important indicator. But there are other indicators based on volume.
The volume-weighted Average Price (VWAP) combines volume with price behavior. In a practical sense, this is the ratio of the average price of an asset for a certain period to the volume. This is a more useful indicator than just the average price, since it takes into account at what price level the largest trading volume was.
How do traders use VWAP? As a rule, VWAP is used as an indicator of current market prospects. In this sense, when the market is above the VWAP line, it can be considered bullish, and below - bearish. Have you noticed how it resembles the interpretation of moving averages? VWAP can really be compared with moving averages, at least in terms of application. As we have seen, the main difference is that VWAP also takes into account trading volume.
In addition, VWAP can also be used to identify areas of increased liquidity. Many traders consider a price break above or below the VWAP line as a trading signal. However, they usually also include other indicators in their strategy to reduce risks.
What is a parabolic SAR system?
The SAR parabolic system is used to determine the trend direction and potential reversals. SAR means Stop and Reverse – "stop and reverse". This is the point at which you should close a long position and open a short one, or vice versa.
The parabolic SAR system looks on the chart as a series of points above or below the price. As a rule, if the points are lower than the price, it indicates an uptrend, and if higher - a downtrend. A reversal occurs when the points move to the other side relative to the price.
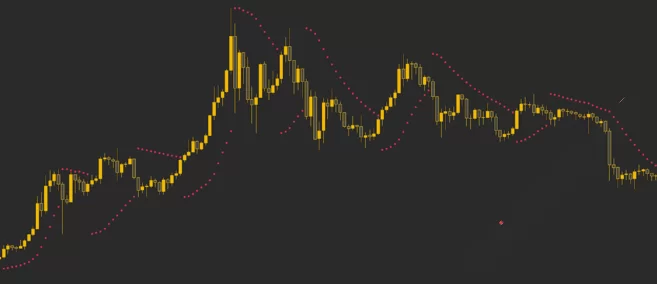
In addition to the fact that the parabolic SAR system allows you to see the direction of the market trend and determine the pivot points, some traders also use it to set moving stop losses. This particular type of order moves with the market and allows investors to protect their profits during a strong uptrend.
The parabolic SAR system works best during strong market trends. During periods of consolidation, it can give many false signals about a potential reversal.
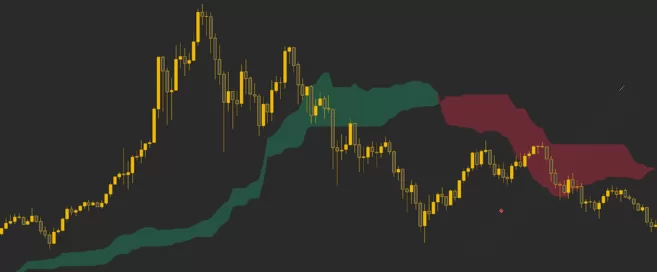
What is the Ichimoku Cloud?
Ichimoku Cloud is a technical indicator that combines many indicators on one chart at once. Among the indicators we discussed, the Ichimoku cloud is definitely one of the most difficult. At first glance, it is difficult to understand its formulas and mechanisms. But in practice, using the Ichimoku cloud is not as difficult as it seems, and many traders use it, as it can provide very clear and clear trading signals.
As already mentioned, the Ichimoku cloud is not just an indicator, but a whole set of indicators. It allows you to understand the market momentum, support and resistance levels, and trend direction. This is achieved by calculating five average values and displaying them on a graph. These averages also form a "cloud" that allows you to predict potential support and resistance areas.
Despite the important role of averages, the key part of the indicator is the cloud itself. As a rule, if the price is higher than the cloud, we can assume that there is an uptrend in the market, and if lower– a downtrend.
The Ichimoku cloud can also amplify other trading signals. This indicator is difficult to master, but if you understand how it works, you can get excellent results.