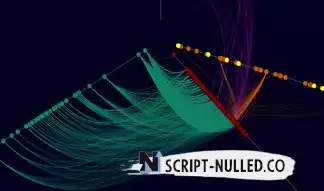
A Hive Plot visualization of Anonymity on the Dark Web
Tor Anonymity Network Visualization using D3.js and OnionScan
This Hive Plot visualization explores anonymity on the highly connected Dark Web using D3.js. Although sites on the darknet offer to protect the privacy of their visitors and owner, administrators can inadvertently leak details that put everyone at risk. Staying anonymous on the so-called dark web is hard and it doesn’t guarantee security. This visualization wants to uncover the true privacy infrastructure of the Tor anonymity network and provide a tool to understand network properties that threaten the privacy of these services.
This visualization uses OnionScan to scan 8,176 .onion hidden services on the Tor anonymity network and gather various identifying metadata associated with them. We use this metadata in various ways within the hive table to explore relationships and patterns between hidden services using identity correlations such as IP addresses, SSH keys, PGP fingerprint keys, related Clearnet sites. Curved links connect related entities. A lot of interesting exploratory work can be done with this data to begin to uncover relationships and patterns regarding privacy preservation and anonymity networks on the Dark Web.


 Spain
Spain
 Portugal


